Graph Editor
Graph Editor Overview
When you create keyframes for items, you specify a set of keys for the item’s animation channels (generally position, rotation, and scale, but also light intensity, etc.). The Graph Editor provides both a more global and more detailed way to alter the settings that govern an item’s animation channels. You have all of Layout’s keyframe editing capabilities, plus some others like dragging keyframes to different frames or graphically adjusting keyframe attributes. Use it to visually fine-tune or dramatically change an item’s animation characteristics.
The Graph Editor also controls all envelopes for options like light intensity, color, camera zoom, etc.
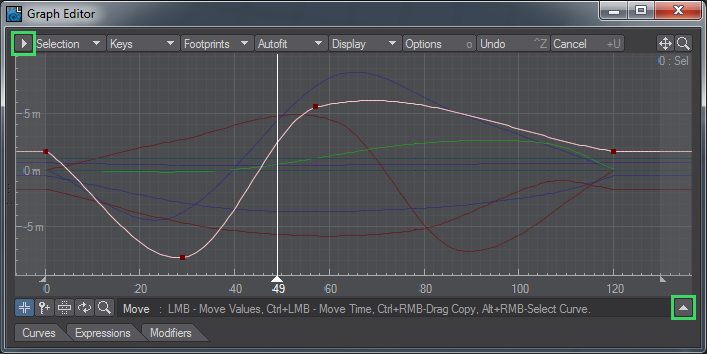
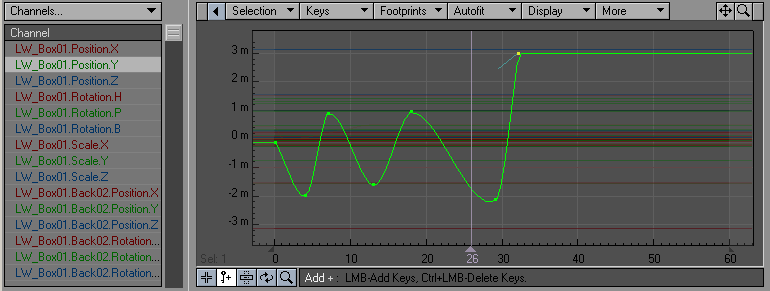
Each Animation Channel is displayed on a two-dimensional graph. Time is constant along the bottom, and the Channel value or setting is equal to the vertical position. Because time is constant, you can visually judge things like where an item slows down or speeds up based on the slope of the curve. The Graph Editor is a great way to identify and fix those annoying hiccups, which can occur from time to time in what should be a smooth animation.
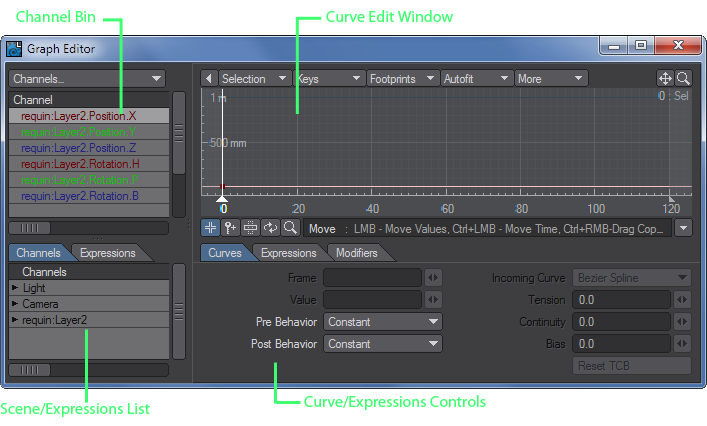
The Graph Editor has four major interface areas: the Channel (Curve) bin, the Curve Edit Window, the Curve/Expressions controls, and the Scene/Expressions list.
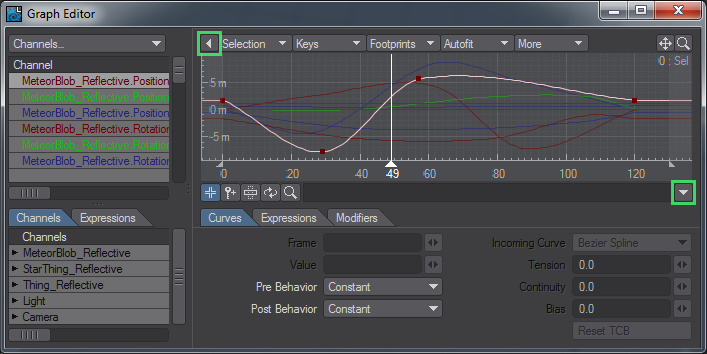
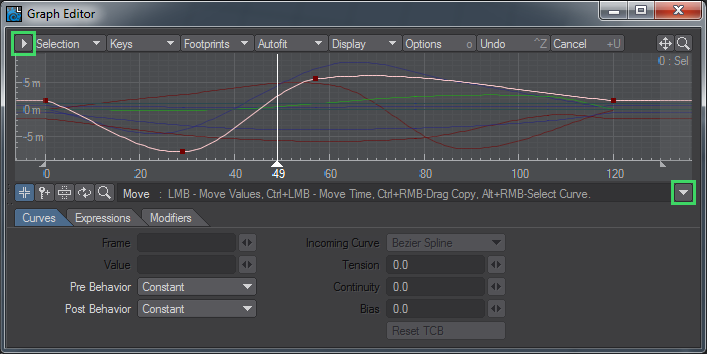
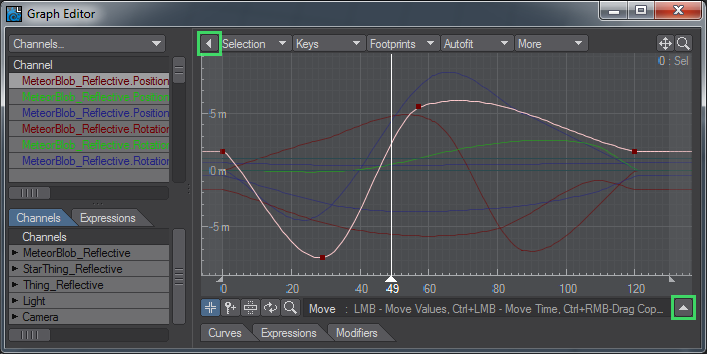
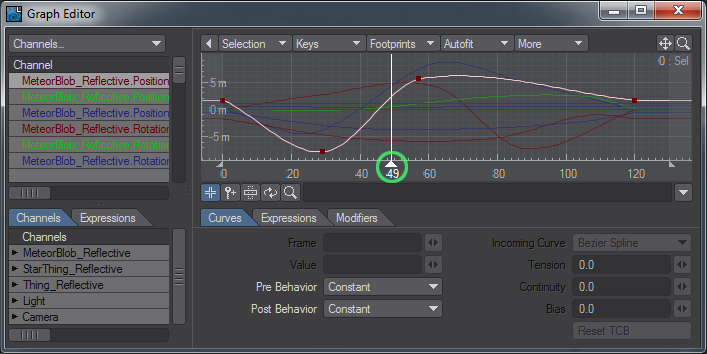
You can click the Collapse buttons to hide the left side and bottom areas of the panel to increase the screen real estate used by the Curve Edit window. When the left side is collapsed, the primary selected curve is shown in the information field.
Collapse buttons
Collapse Trees Active
Collapse Tabs Active
Collapse Trees and Tabs Active
Frame Range
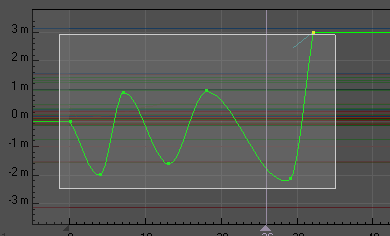
If frames outside the range of frames in your scene (i.e., less than your first frame or greater than your last frame) are visible in the Curve Edit Window, those areas will be slightly darkened. There will also be a small handle at the very bottom of each border. You can drag these to interactively adjust your scene’s first and last frame.
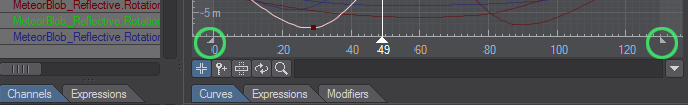
Start and Last Frame handles
The Time Slider
You can grab the time slider in the Curve Edit Window by its base and drag to change Layout’s current frame. The current frame is displayed below the slider handle.
Clicking at the bottom of the graph - where the frame slider handle would be - moves the frame slider to that frame.
Panel Layout Adjustments
You can drag the border between the Scene list and Channel Bin, and between the Channel Bin and Curve Edit Window to change the spacing between the two sides (if the Graph Editor is not at its minimum overall size).
Using the Channel Bin
When you first open the Graph Editor, the Channel Bin displays the appropriate curves for the currently selected item. The Channel Bin is merely a repository to show you which curves are available for display and edit. Deleting curves from this window will not affect your scene. This system makes it very simple to edit multiple curves from several different items.
To replace/add channels to the Channel Bin:
- Locate the desired item in the Scene list.
- Double-click on an individual channel or an item name (for all its channels). This will replace any existing channels in the bin. To add the channels to the Channel Bin hold the Shift key as you double click on an item or its channels, or drag it into the bin. If you use the drag method, you can drag multiple channels/items into the bin by selecting multiple items in the Scene list (Shift key for range and Ctrl for non-contiguous selection).
To remove channels from the bin, select them and hit Shift D. Once you add channels to the bin, you can rearrange their order by dragging and dropping.
The Channels Pop-up
The Channels pop-up menu, above the Channel Bin, has a few functions. You may select Filter to filter out channels from the Channel Bin that do not match a pattern. The pattern is case sensitive. *.Position.* would remove any channel that wasn’t a Position channel. You could use *.Y to show only Y channels.
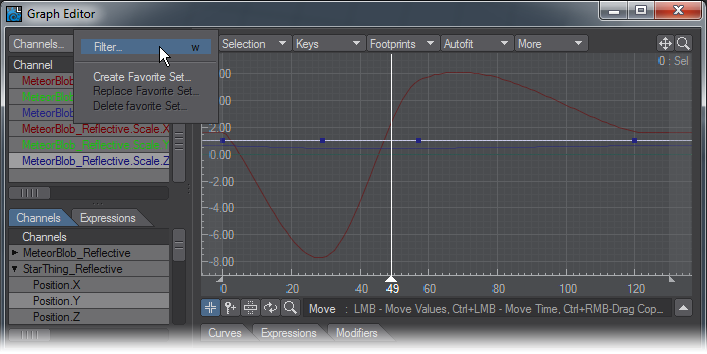
Choose Create Favorite Set… to manage curve sets. It lets you create sets of editable curves so that you can easily switch between different combinations of curves to manipulate during a session. To create a favorites entry:
- Make sure the desired curves appear in the Channel Bin.
- Select Create Favorite Set… from the Channels pop-up menu.
- Enter an appropriate name in the input field that appears and click OK.
You can revert to any saved favorite set of curves by selecting it from the bottom of the Channels pop-up menu.
Choosing Replace Favorite Set… lets you replace an existing favorite set with the curves currently in the bin. Choosing Delete Favorite Set… lets you remove an existing favorite set from the Channels pop-up menu.
Editing Curves
With the Graph Editor, you can easily edit multiple curves simultaneously or use curves from different items as references. Since you can mix curves of different types in the bin, you can do interesting things like compare the curve of light intensity with the X position of an object - any curve in LightWave can be compared or edited together!
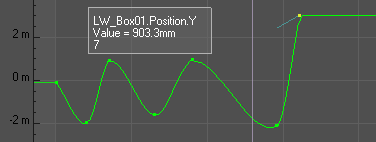
You can interactively cut and paste key frames from one curve to another as well as simply replace an entire curve. This is also a good way to lock areas of curves together. By selecting multiple curves when you create keys the curves can be identical at those segments of the animation. If you put your cursor over a key you will see a data label pop up to inform you of that point’s Curve, Value, and Frame.
A Key’s Data Label
Edit Mode Selection
You can select from the edit modes by clicking one of the buttons beneath the Curve Edit window. From left to right, the mode buttons are Move, Add, Stretch, Roll, and Zoom. Pressing your Spacebar cycles you through the modes.
The information display, just to the right of the buttons, will display the name of the selected mode button, the shortcut key, and mouse operation information.
To select curves for editing
Click on the channels in the Channel Bin to select their curves for editing. (Hold the Shift key for range and Ctrl for non-contiguous selection). Selected curves will become highlighted, but unselected curves will still be visible as a reference. You can also Alt+RMB on a curve in the Curve Edit window to make it the (only) selected curve. Use Alt+Shift+RMB to add the curve to the current curve selection.
Your keyboard up and down arrow keys will cycle the selected key through the curves in the curve bin. Hold the Shift key as you press the cursor keys to increase or decrease the curves selected.
When multiple curves are selected, one will be the “primary” selected curve, and its selection color will be a little brighter. Some commands, like Fit Values by Type, use the primary selected curve when more than one is selected.
To select/unselect keys for editing
In Move mode, select keys by clicking on them with your LMB. In any mode, except Roll, you can drag out a bounding box with your RMB. This will toggle the state of the bounded group of keys. To add to or subtract from a selection, hold the Shift key. To deselect all selected keys, just right click in the graph. To select all, Shift+double-click.
If only a single key is selected, you can use your keyboard left and right arrow keys to cycle the selection of keys along curves.
To add keys to curves
- Select the channel curve(s).
- Click the Add Mode button, or press the keyboard shortcut + .

- Click on the graph at the desired frame (horizontal) and value (vertical) position. Before you release the mouse button, you can drag up and down to adjust the value. Hold the Ctrl key to adjust the frame.
Adding keys to curves
You can double click on an existing active curve to add a key where you click while in Move mode. The cursor will have extra lines added to it when in a good position, as shown.
To delete keys from curves:
- Select the channel curve(s) and then the key(s).
- Press the Delete key.
In the Add mode, you can delete keys with Ctrl + LMB.
Context Menu
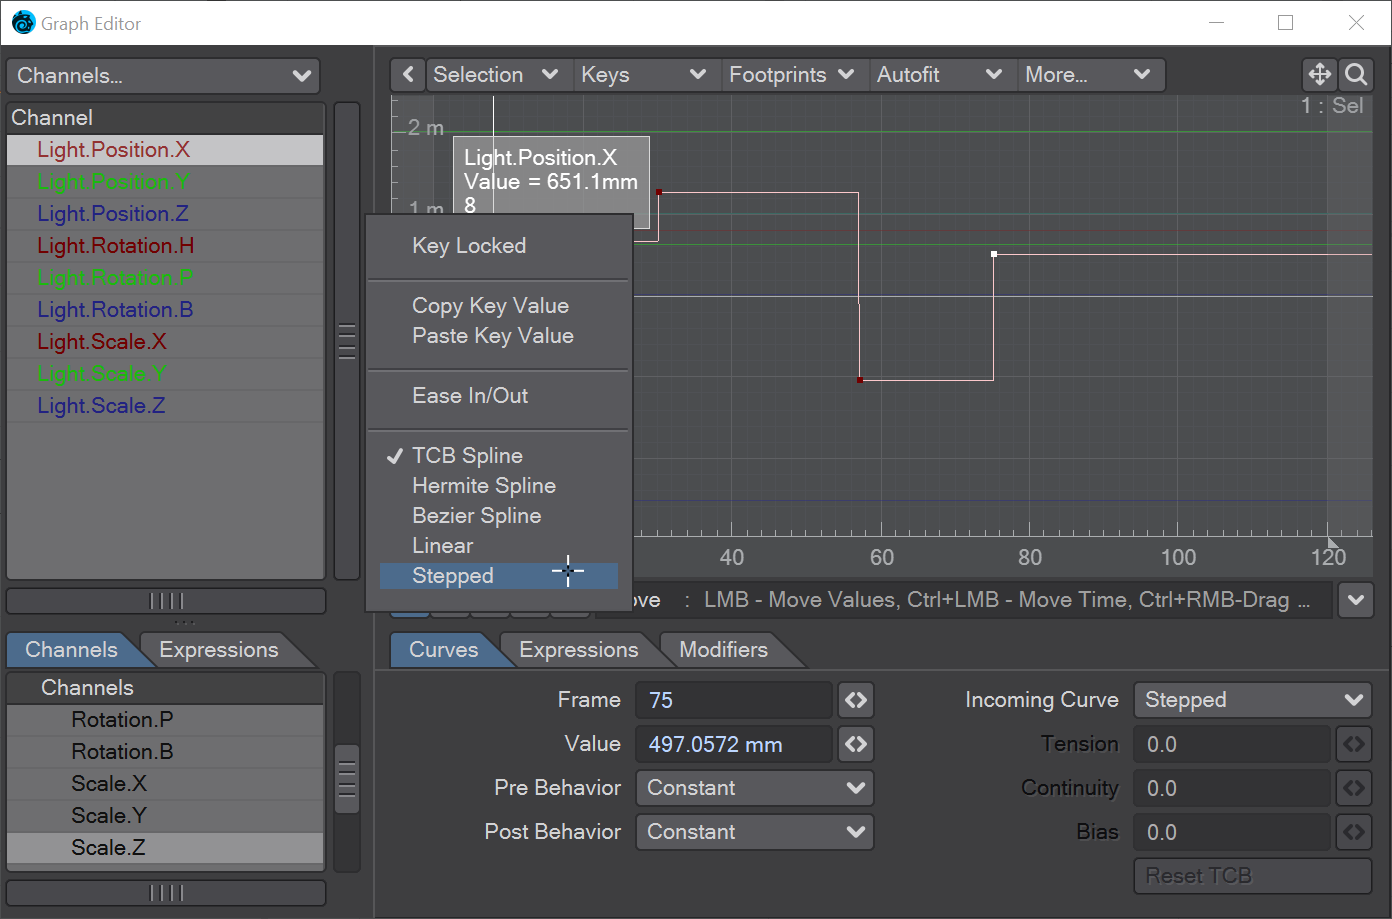
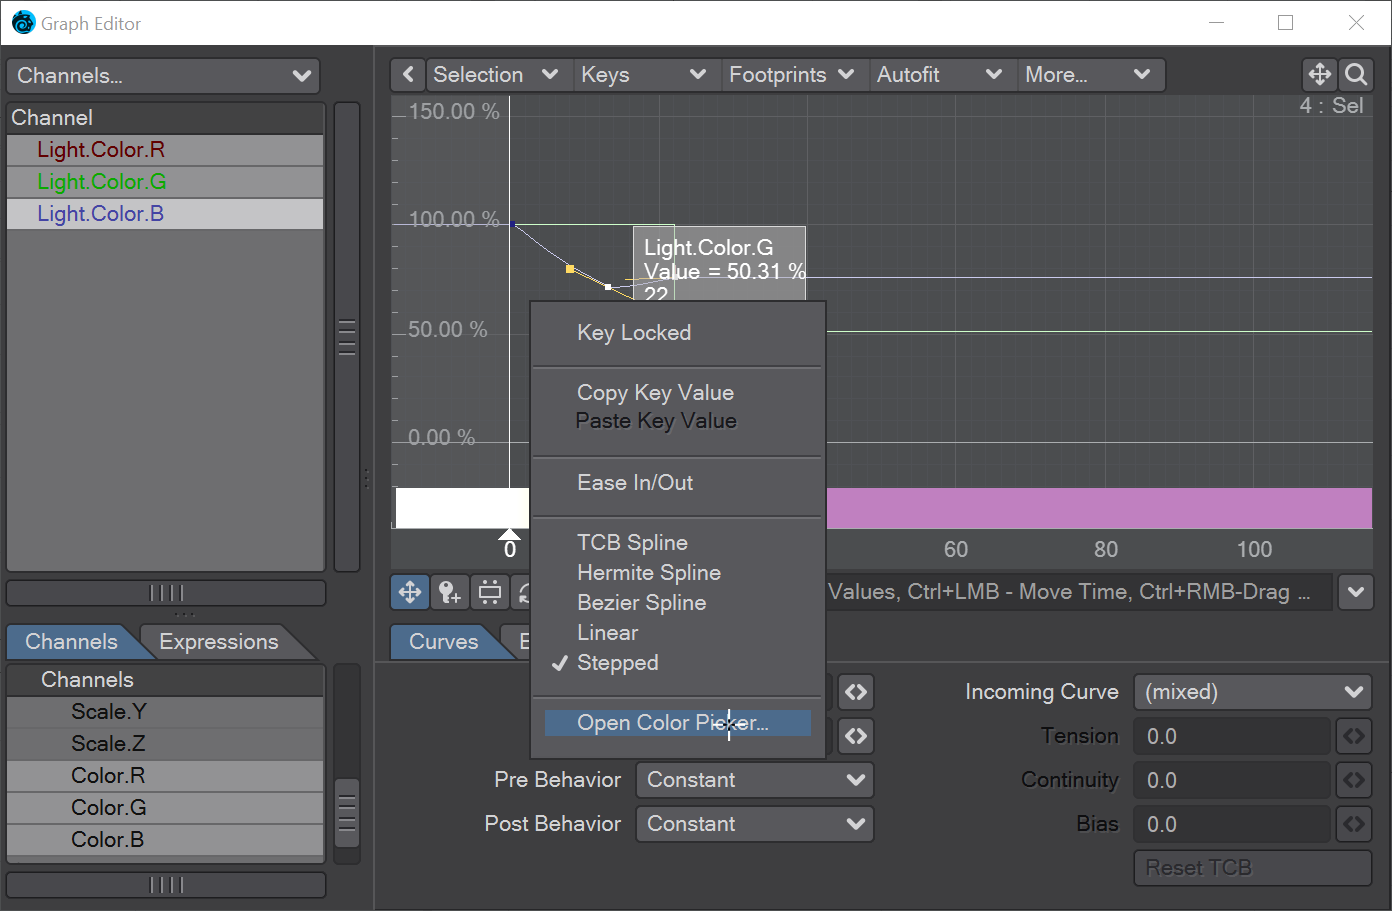
Right-clicking on a key in the Graph Editor and right-clicking a Color key
You can right-click on keys in a graph and see a context menu that presents several options:
- Key Locked - toggle for locking a key. Only one key will be locked even if multiple are selected
- Copy / Paste Key Value - Allows you to copy the values assigned to a key and paste them to a different key
- Ease In/Out - Sets the Tension to 1.0 on all selected keys
- Incoming Curve Type - Converts selected key to the curve type requested between TCB, Hermite, Bezier, Linear, and Stepped spline types. Does not work with multi-select
- Open Color Picker - This entry only appears when you are editing a color graph. Changing the color applies to all three keys (RGB).
To change key value/time
- Select the key(s) and click the Move Mode button (or press the keyboard shortcut T).

- Drag with your LMB to change the value. Hold the Ctrl key to change time.
To scale selected keys
- Select the key(s) and click the Stretch Mode button, or use the keyboard shortcut H.

- Place your mouse pointer at the position you want to use as the center of the scaling.
- Drag using your LMB to scale value. Hold the Ctrl key to scale time.
To roll a range of keys
- Select the Roll mode or use the shortcut Y.

- Drag out the time range using your RMB.
- Drag your LMB to roll the keys-as keys go past the end of the range, they reappear at the other end of the range.
To Zoom in and Out of the Graph Workspace
- Select the Zoom tool

- Drag your Left Mouse button and drag a bounding box in the area you want to magnify.
- Right Click to Zoom out. You can also use the Magnifying Glass icon at the top right of the Graph Editor, or the normal keyboard shortcut of Ctrl+Alt+LMB to interactively zoom in and out (or the scroll wheel).
Copying Keys
You can copy keys using your mouse or keyboard.
To copy selected keys with a mouse:
- Select the keys for editing. Any mode except Roll can be used. Drag using Ctrl + RMB .
- When you copy a single curve, an insertion point marker (and paste time display) will appear as your pointer moves over the curve. Release the mouse button to insert. Move your pointer off the curve to abort the paste.
- When you copy multiple curves, color-coded insertion marks will appear. With your mouse pointer not directly over a curve, release to paste. Selected keys may be on different curves, but they can be copied only onto the same curve.
Existing keys will be shifted over if you paste in more than one key (unless the Insert Overwrites Keys option is enabled).
See also the Copy Time Slice command (Keys > Copy Time Slice), page PDF_LINK
Graph Editor: Adjusting the Curve Edit Window
Like other LightWave viewports, you can pan around the graph by holding the Alt key as you drag around the Curve Edit Window. Alternatively, you can use the drag-window drag button in the upper-right corner. You can change the zoom by holding Ctrl+Alt while you drag or by dragging on the zoom-window drag button in the upper-right corner.
Zooming and Panning
The Zoom Box tool button is the right-most Mode button. Click it and you can drag out a box on the graph and zoom in on that area.
You can get a 2X zoom out by clicking your RMB with the Zoom Box tool selected. The zoom out will be centered at the point you click.
If you have a mouse wheel, scrolling it over the Curve Edit window will affect the zoom. Hold the Ctrl key to pan horizontally and use Ctrl+Alt to pan vertically.