Plot 1D
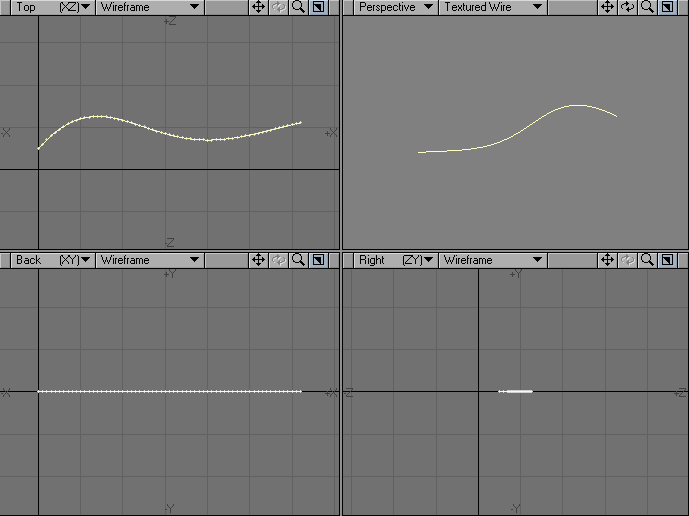
The Plot1D tool, which is located in Create > Curves: Plot1D, generates either a curve consisting of two-point polygons or a spline curve. The curve is generated along the X axis, and its height is in the Z axis. Get your maths head on for this tool.
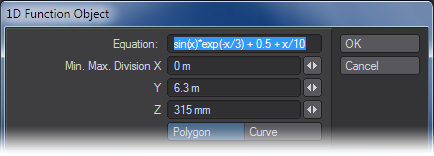
The height is determined by the value of the expression in the Equation field at each x. In the fields Min, Max, and Division, enter the x value for the start of the curve, the x value for the end of the curve, and the number of divisions of the curve.